Movebank is an incredible repository of animal GPS tracks from all over the world, containing data from over 7,000 different studies. A dataset of GPS tracks will include a set of timestamped coordinates that are associated with a given animal. The theory here is that we can connect temporally adjacent coordinates from an animal to create an estimate of its trajectory of movement over time. After discovering this data, I worked on a couple of projects where I explored web-based options for interactive, cartographic visualization. My goal in these projects was to do justice to the rich spatial and temporal characteristics of animal movement data.
Take a look at the movement of eagles in British Columbia and fishers in Albany
Eagles in British Columbia 
I first took a look at some data from close to home. Thanks to efforts from the Hancock Wildlife Foundation, I was able to access and download data that captured the movement of ten different eagles off the coast of British Columbia from over 1-2 years. With an average temporal granularity (the time between point measurements) of between 2-6 hours during the eagles’ waking hours, this dataset included nearly 25,000 GPS points.
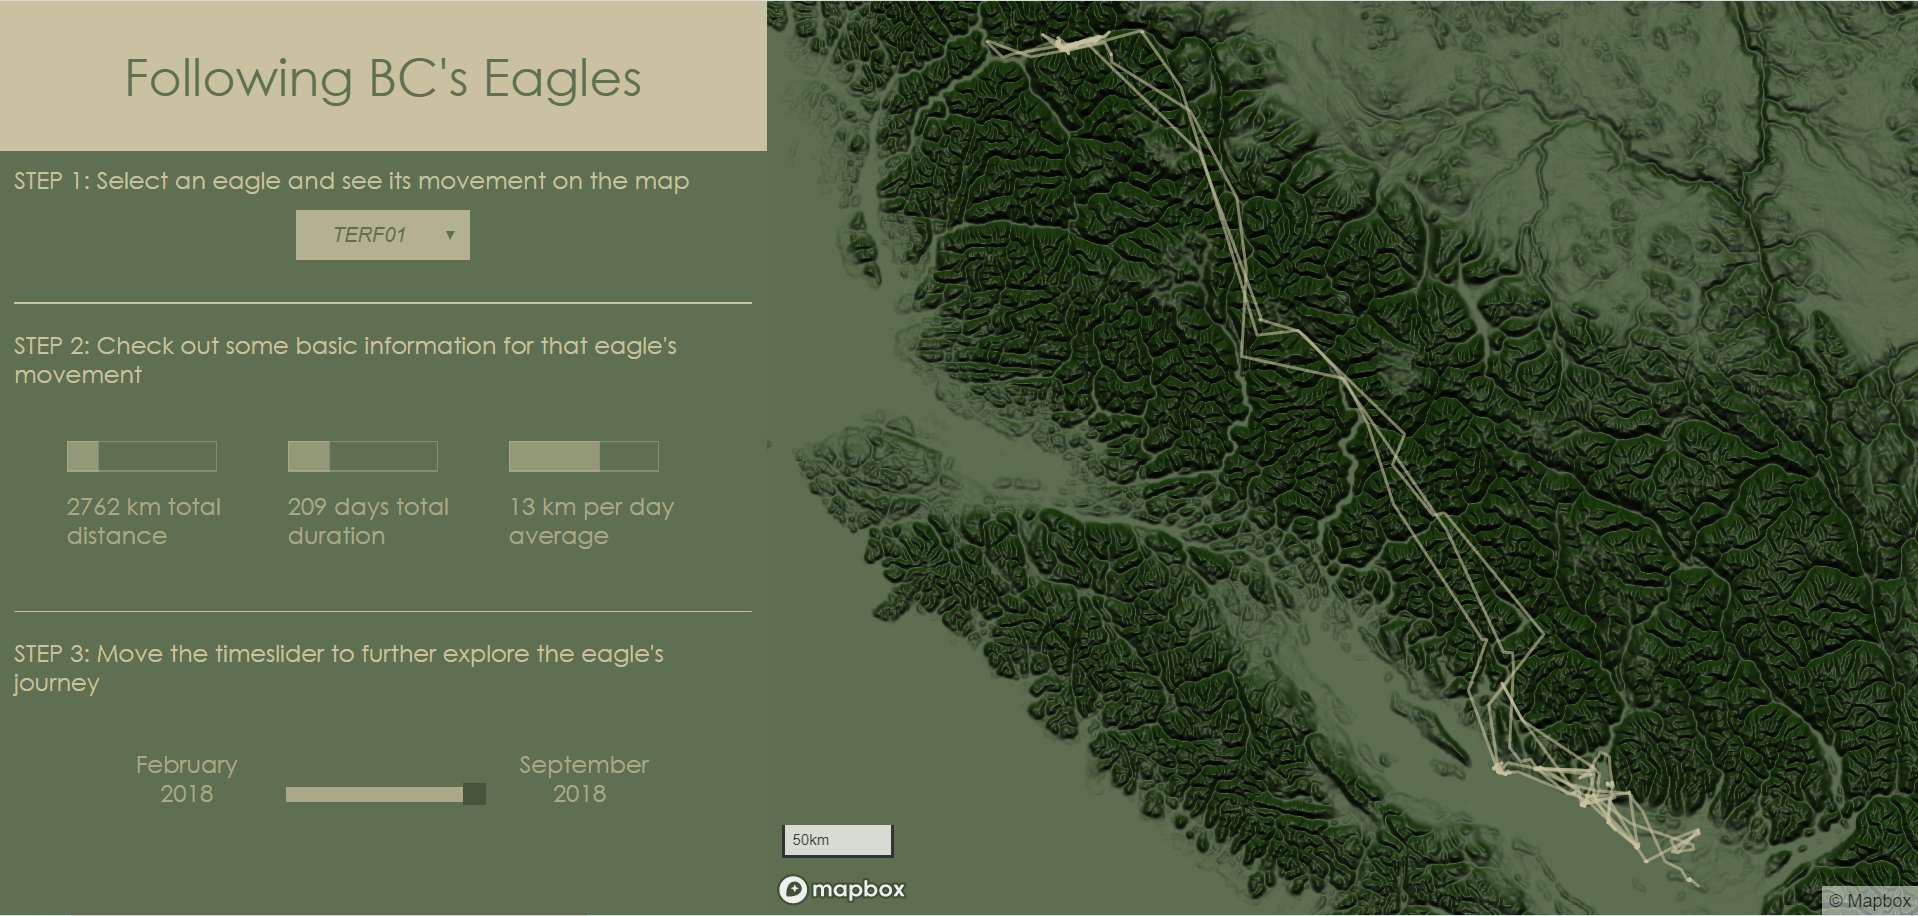
As shown in the image above, I used Mapbox Studio to create a simple basemap over which to overlay the data. The path of each eagle is visualized on this map using lines to sequentially connect each of the GPS points. Given the uneven and non-continuous temporal sampling, I’ll admit that the path of each eagle appears quite unnatural. I attempted to integrate the temporal dimension of this data by creating a time slider, allowing the user to view the total extent of each eagle’s movement at different points in time, giving the impression of a kind of manual animation. This was accomplished with a simple function that is called every time that the time slider is moved, updating the data seen on the map by slicing the array of coordinates in the input GeoJSON.
// update the map by cutting the coordinates array
function updateMap(newtime, data){

    // cut the coordinates based on the time input
    newData = data.slice(0, newtime);

    // new data to add to the map
    data = {
    'type': 'Feature',
    'properties': {},
    'geometry': {
    'type': 'LineString',
    'coordinates': newData
    }}

    // update the data on the map
    map.getSource('route').setData(data);

}
I also used d3.js and turf.js to create the simple bars on the left-hand side of the page that allow the user to see the basic statistics of each eagle’s movement trajectory.
While I was pleased with the overall graphical elements of this visualization and the simple interactivity, I hoped to improve on my approach to making the movement appear more realistic.
Ultimately, however, it is really interesting to see the path that each eagle follows over time. Most of the eagles in this dataset appear to follow similar paths along the entire extent of BC’s coast, however some stay quite close to Vancouver. Check out this page to explore the lives of some of BC’s eagles for yourself, or take a look at the code for this example here!
Fishers in Albany 
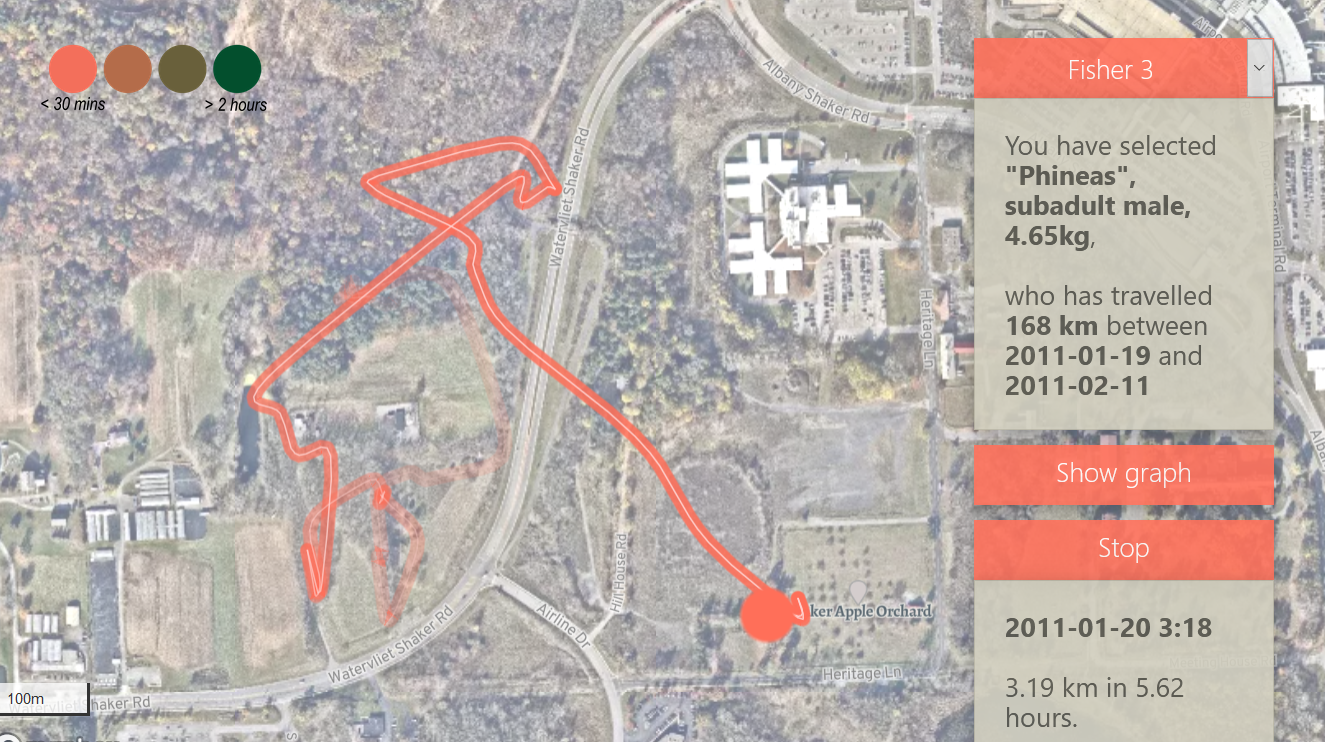
For my next project, I focused on the movement of animals in urban environments, looking specifically at fishers in Albany, New York (thanks to research conducted by Scott LaPoint et al.). The temporal granularity of this movement data was a significant step up from my previous work with the eagles. Each of the fishers had their location sampled at least every hour while awake (and often every 10 mins!), although only for about a month in total duration.
To show a more natural-looking movement trajectory for these animals, I elected to do a spline interpolation (using R’s xspline function, as shown in the code sample below) on the existing ‘control points’ in the original dataset of GPS tracks. This preprocessing step gave me a much larger number of GPS points for each trajectory (approximately 10X the number of original points). This interpolation created the impression of a much smoother (and therefore more realistic) pattern of animal movement.
a <- xspline(selected$lat,selected$long, shape=-0.5, draw=FALSE) # Compute spline
out <- as.data.frame(cbind(a$x, a$y)) # Interpolated coords as dataframe
colnames(out) <- c('lat', 'long') # Rename columns
out <- out[!duplicated(out[c(1,2)]),] # Drop duplicates
Ultimately, however, this use of interpolation meant that a significant portion of the movement data for each animal was synthetic. I realized that this was potentially problematic, given the uneven temporal gaps between each point in the original data. The interpolated data connecting each control point is a rough estimation that is less likely to be accurate if more time has elapsed between each control point. Put simply, an animal will have had a larger range of potential movement with a larger temporal gap between points.
To communicate this uncertainty, I first made sure to make a visual distinction between control points from the original dataset, where we are certain that the animal was, and interpolated points, where we have varying degrees of uncertainty about where the animal was. I accentuated these ’true’ points with bold colour and symbology. The colour of each point corresponds to the length of time elapsed since the previous point, which gives the viewer an indication how much they should trust the interpolated path of movement that connected these points. I also made the lines that represent the entire movement trajectory relatively thick and transparent, conveying a sense of ‘fuzziness’ to the viewer.
A screenshot of the resulting animated movement, implemented using Mapboc GL JS, is shown in the example below. Take a look at the code here. The animation can lag a bit sometimes, given the large amount of data processing done in the browser. Hopefully this is something that I can improve upon with future efforts!
This piece of work is part of a larger group project that includes various other visualizations of animal life in or near urban spaces. Take a look at the page for the project: Wildlife in the City.