It’s so satisfying to make some nice looking maps. This time I returned to the more familiar Python and played around with the fabulous OSMnx package from Geoff Boeing. OSMnx is a package for accessing, processing, analyzing, and visualizing road network and building footprint data from OpenStreetMap. This package is very well-documented with many examples, so it was simple enough to get started.
The code that I used to create these maps was pretty much taken directly from this example on Github.
I first imported the necessary packages.
import osmnx as ox
from IPython.display import Image
%matplotlib inline
ox.config(log_console=True, use_cache=True)
ox.__version__
Then set the specifications for the output images.
# set parameters for the images
img_folder = 'images'
extension = 'png'
size = 240
dpi = 300
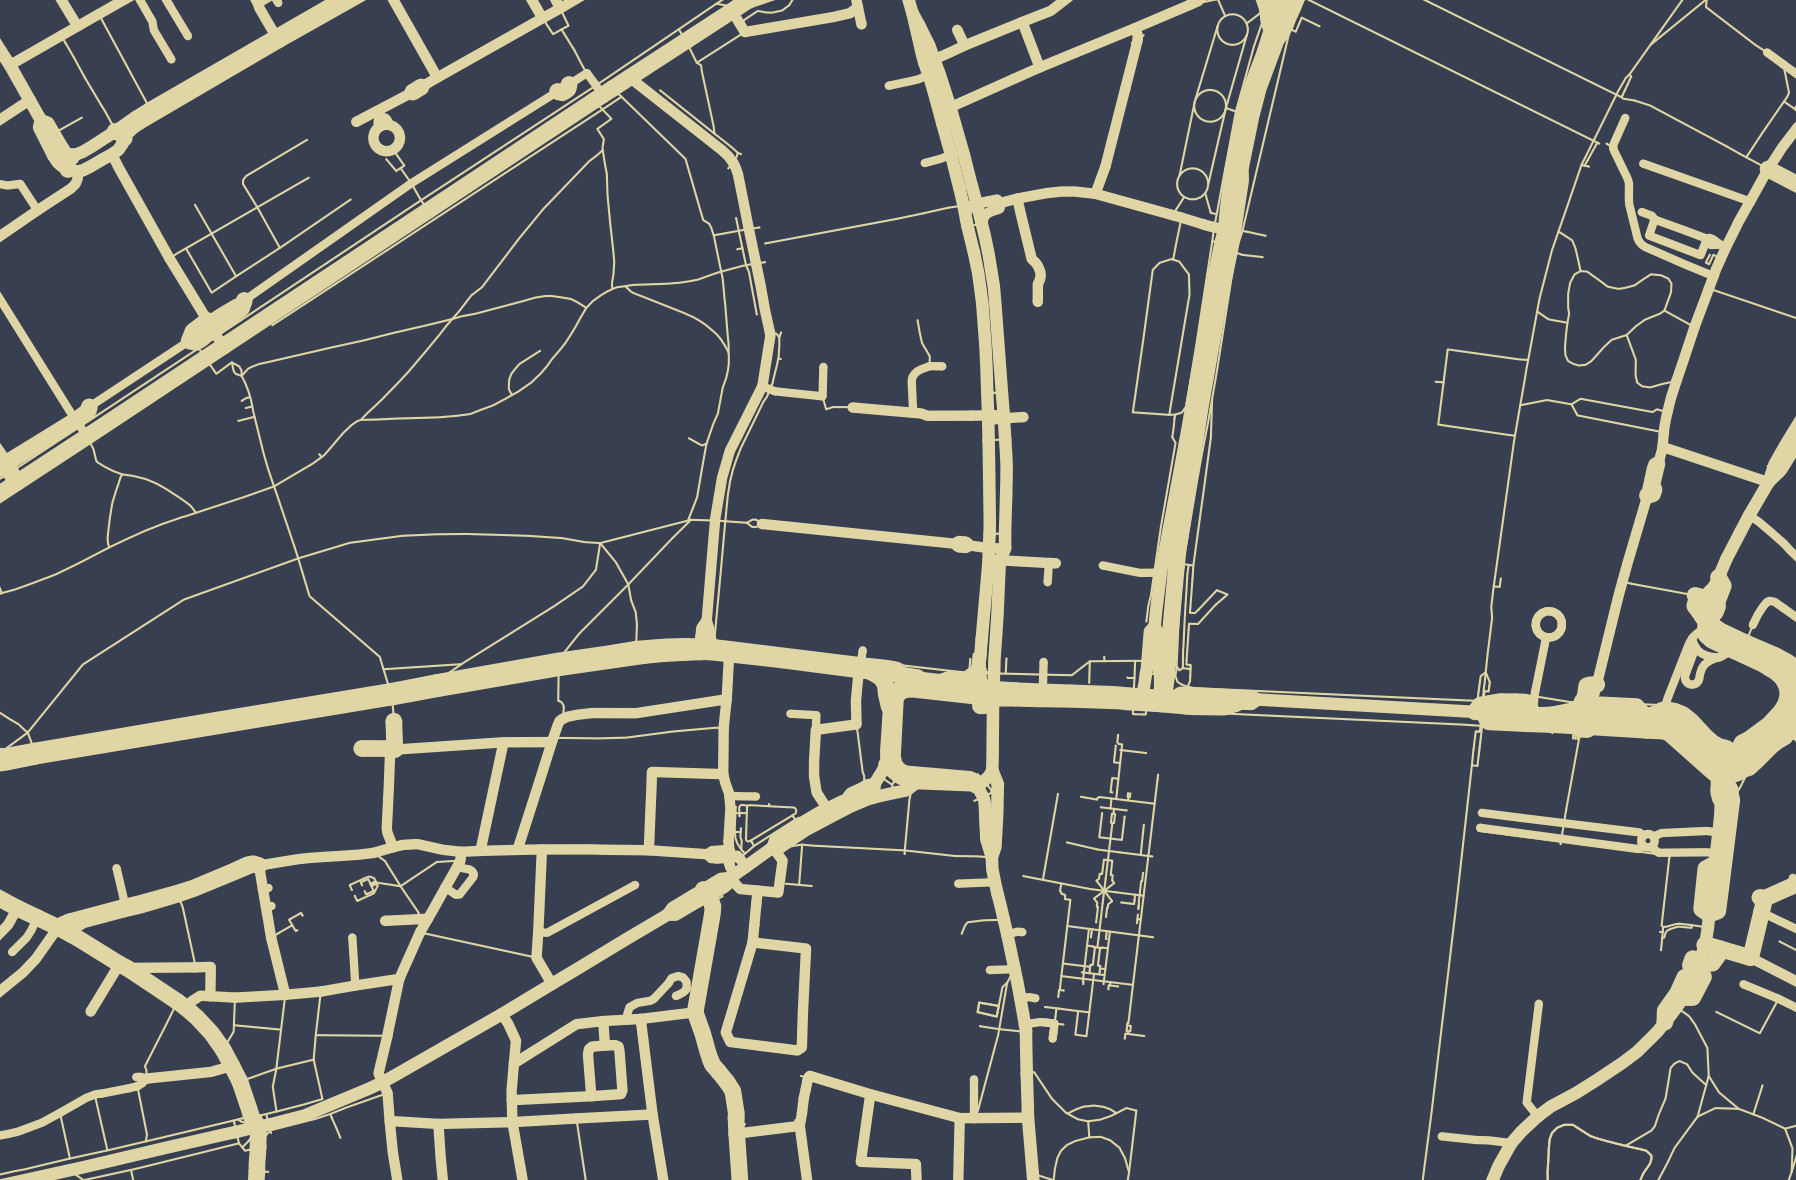
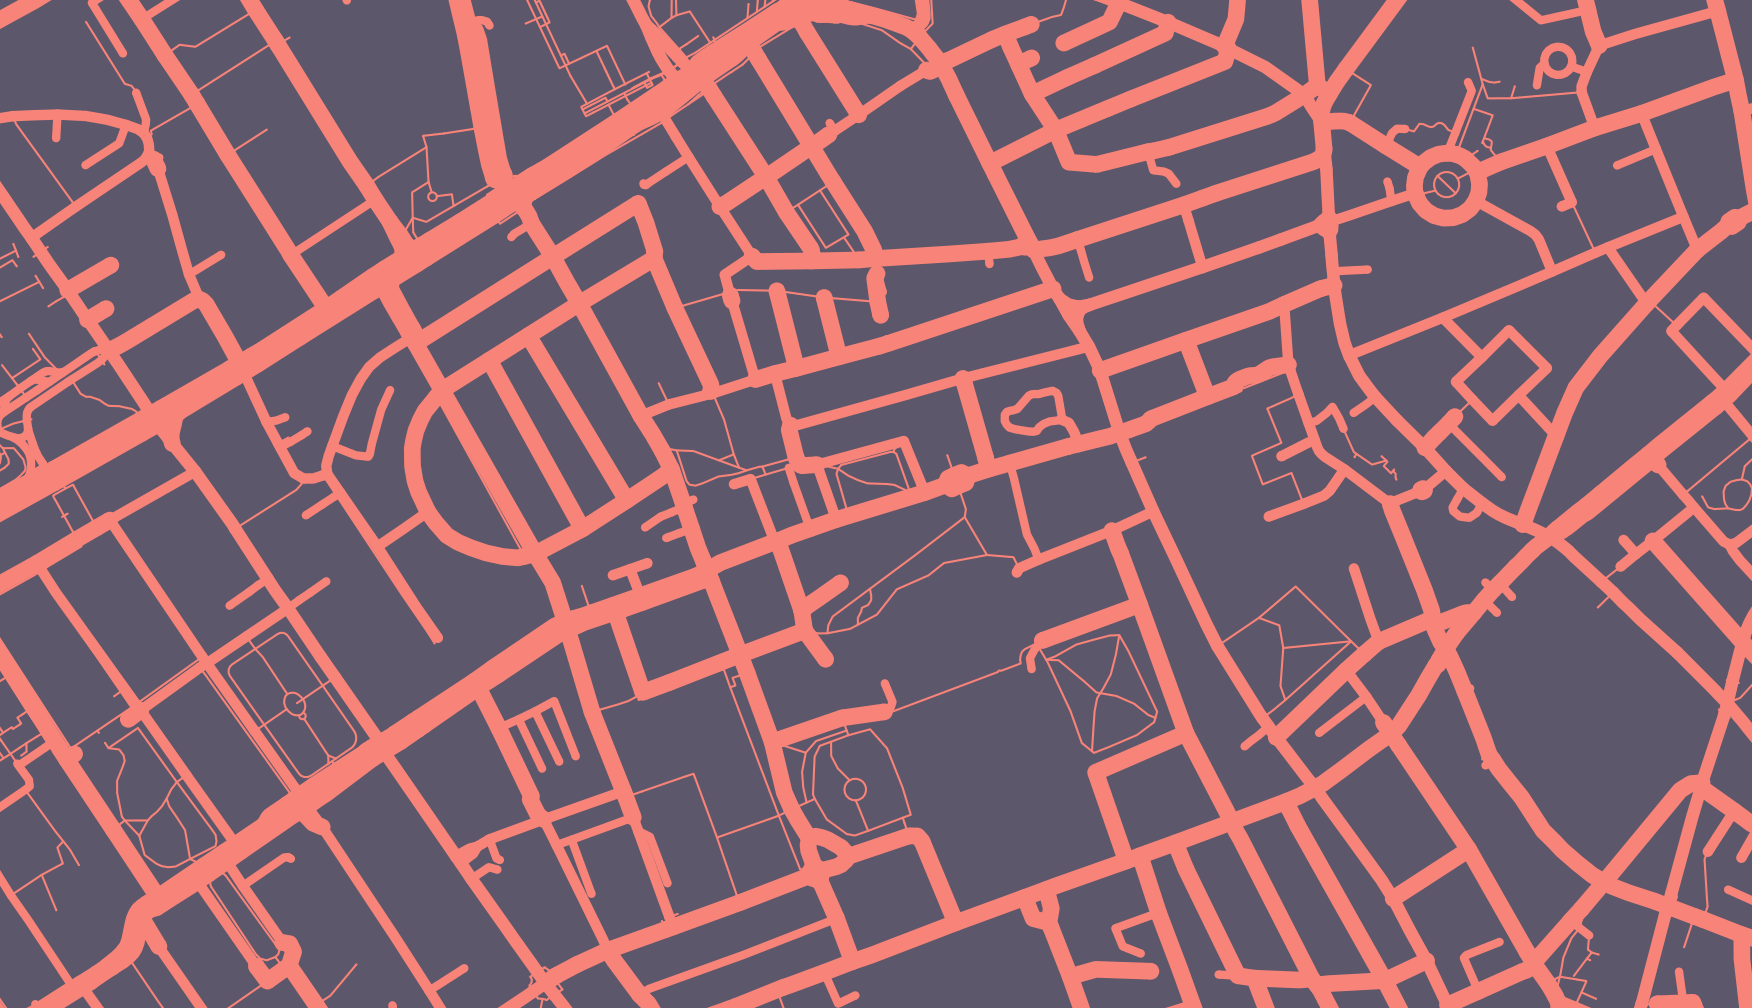
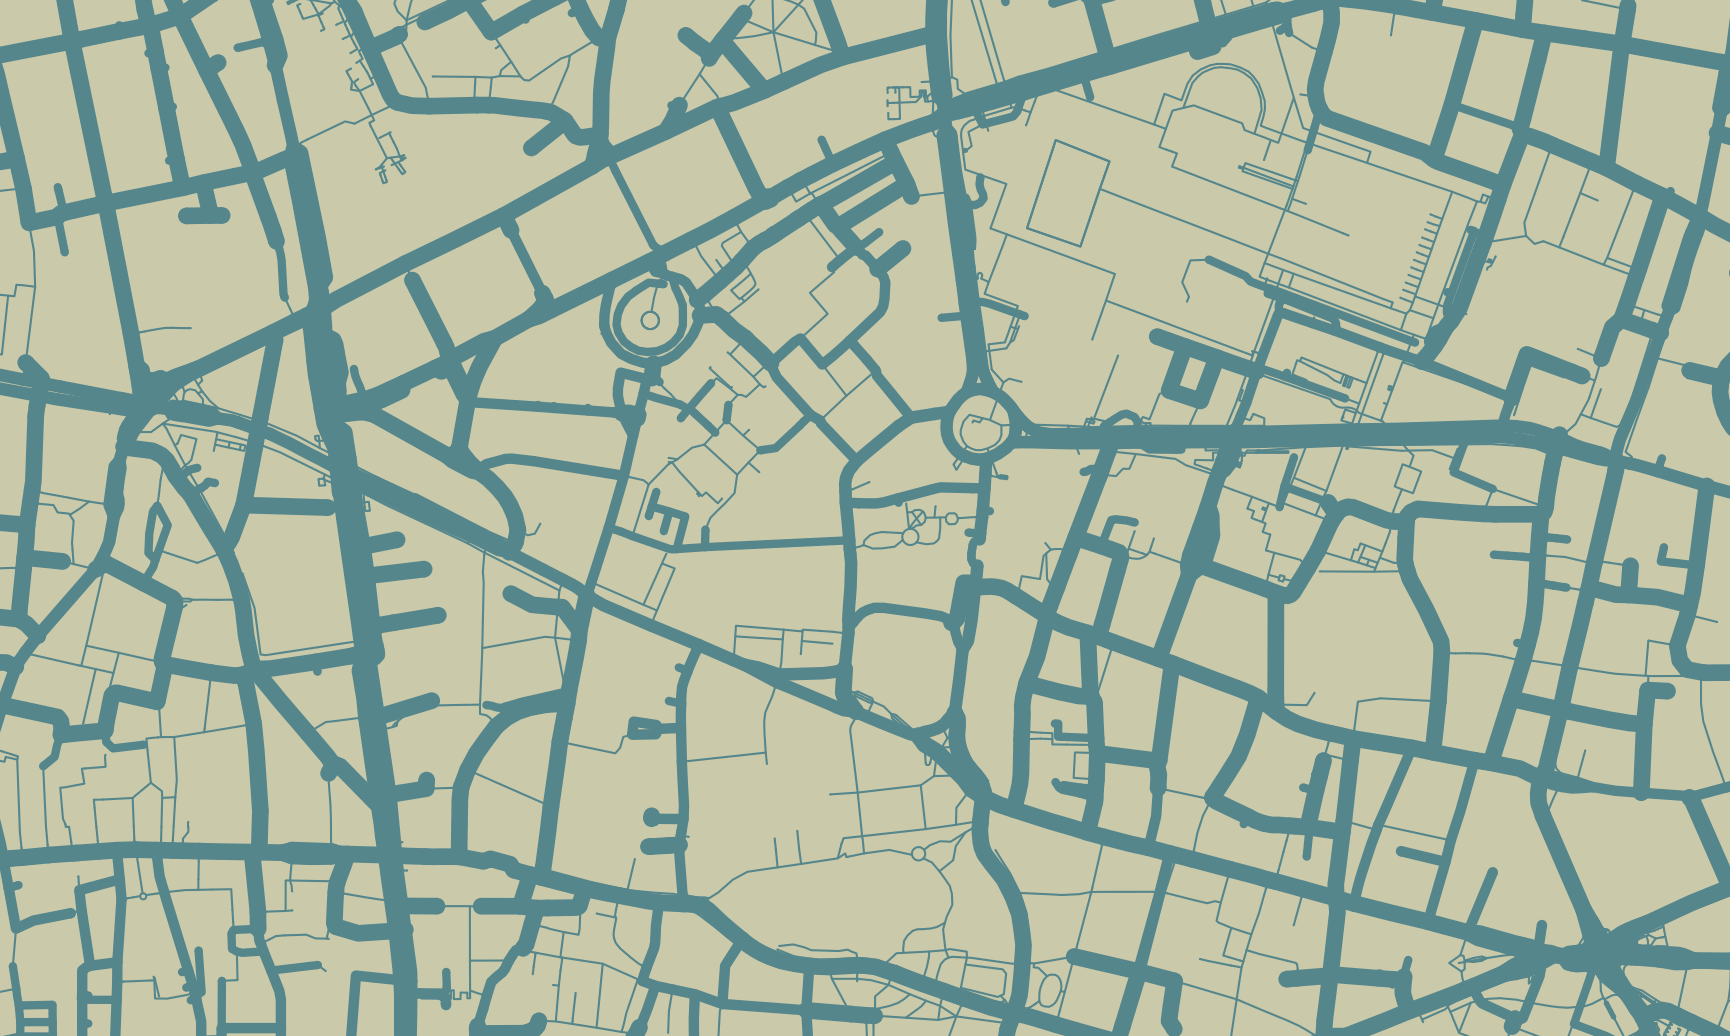
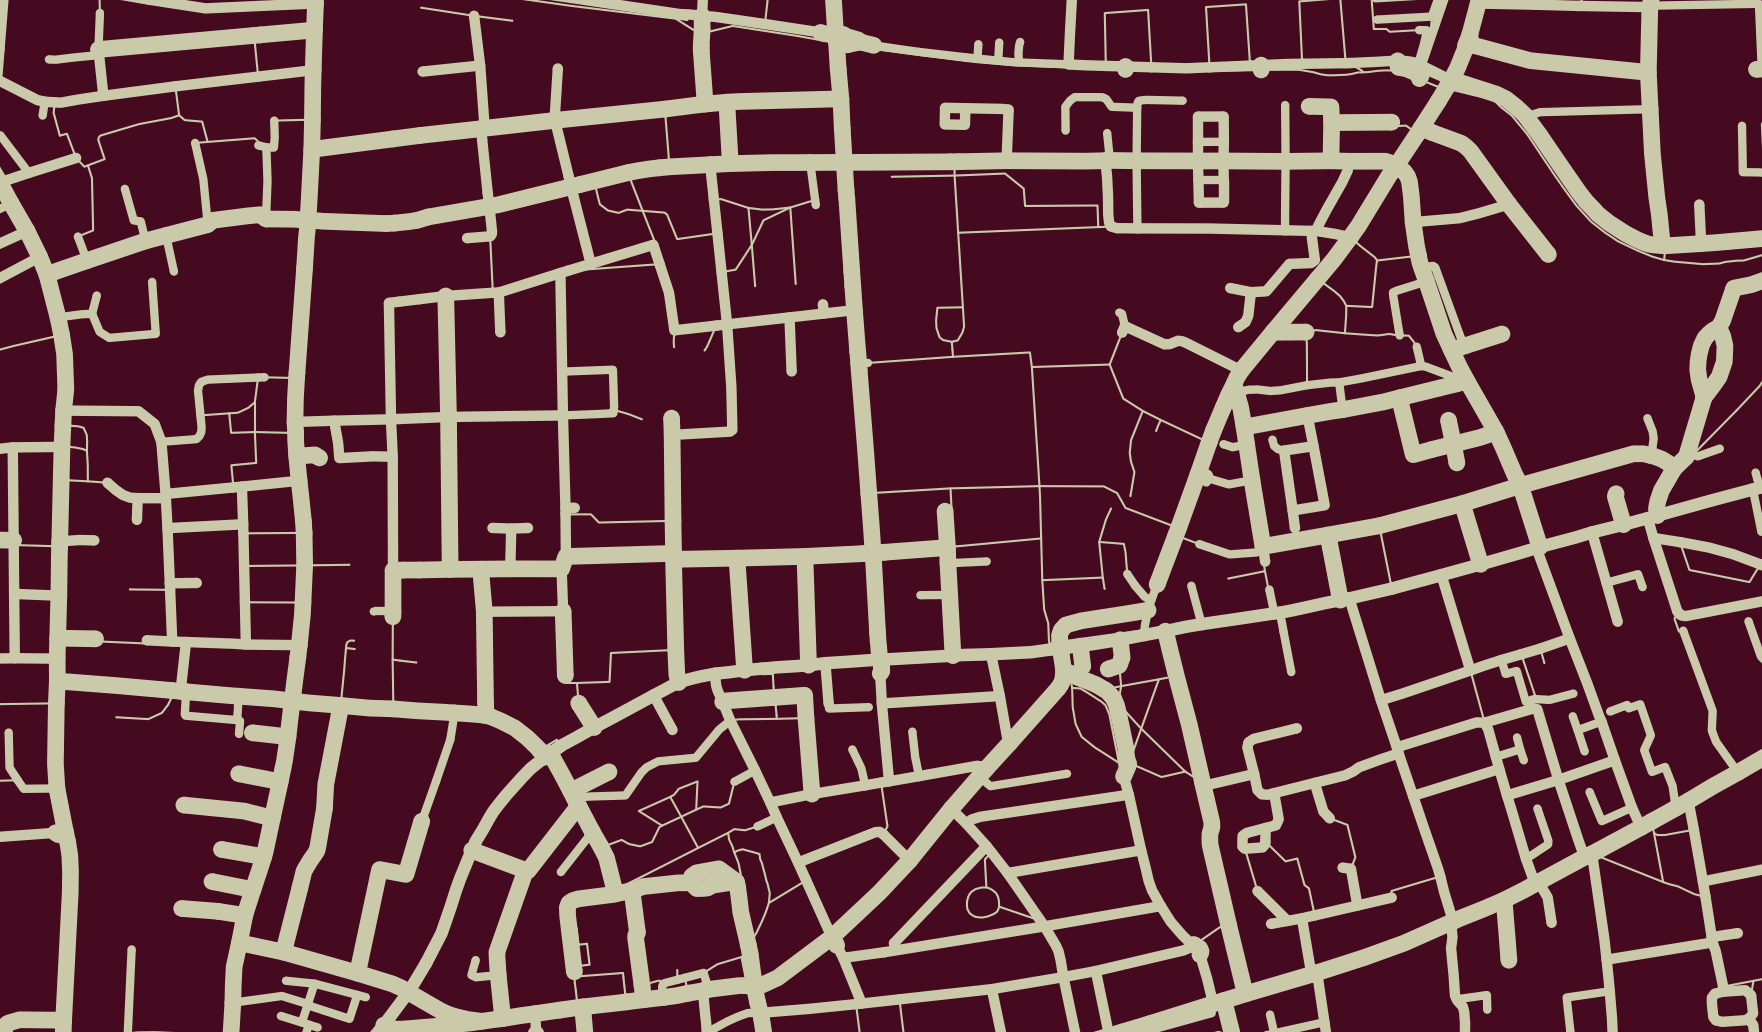
I also stored the center coordinates, colour codes, and street widths that I would use for each map. The categories used to classify streets come from OpenStreetMap. All the coordinate pairs that I selected are from some of my favourite places in London.
# places to create figures from
gh = (51.523438, -0.121536)
wa = (51.499260, -0.127294)
sp = (51.513763, -0.098365)
cr = (51.529066, -0.069620)

# html colour codes
purp = "#5d576b"
coral = "#f88379"
tuscan = "#dfd5a5"
charcoal = "#373f51"
vanilla = "#cacaaa"
teal = "#55868c"
scarlet = "#450920"

# street widths
street_widths = {'footway' : 0.5,
                 'steps' : 0.5,
                 'pedestrian' : 0.5,
                 'path' : 0.5,
                 'track' : 0.5,
                 'service' : 2,
                 'residential' : 2.5,
                 'primary' : 3,
                 'motorway' : 4}
I then wrapped the code to make and save a map inside of a function with parameters for the center coordinates (place), background and edge colours (bcol and ecol), and export file name (place).
def makemap(place, bcol, ecol, point):
    fig, ax = ox.plot_figure_ground(point=point, filename=place, network_type='all', bgcolor = bcol, edge_color = ecol, street_widths=street_widths, dpi=dpi)
    Image('{}/{}.{}'.format(img_folder, place, extension), height=size, width=size)

# calling the function
makemap("goodenough", purp, coral, gh)
makemap("westminster-abbey", charcoal, tuscan, wa)
makemap("st-paul", vanilla, teal, sp)
makemap("columbia-road", scarlet, vanilla, cr)
These maps show the area around some of my favourite places in London. I won’t pretend that they offer much insight into what these areas are like. If anything, these maps show the complexity of downtown London’s road network.
Check out the full code for this exercise here