Only when emotions, feelings, values, and ethics as well as a commitment to social justice become integral elements of our geospatial practices will moral geospatial practices become possible. Only then can GT help create a less violent and more just world. 1
Overview
Our experience of inhabiting space in cities is unique and subjective. The meaning, memories, and emotions that we attach to our surroundings impact the ways that we engage and interact with them. While these elements of our urban lives are often unconscious and thus challenging to convey, they are a fundamental part of our daily experiences in cities.
Drawing on past work in feminist GIS, I collected data on my personal, emotional experience of inhabiting space in London. Specifically, I collected both qualitative and quantitative data to capture my feelings of anxiety for two weeks while going about my daily activities. I explored and visualized this data using both R and QGIS, and produced an interactive map.
Background to approaches in feminist GIS
Many scholars have critiqued GIS for its focus on positivist, scientific, and objective ways of knowing.23 Traditionally, GIS has dealt with quantitative data at larger scales and is based on a Euclidean understanding of space.4 GIS, as such, is not well-suited to represent individual bodies, situated knowledge, or the complex interactions between an individual and the space around them.5
Efforts to combine GIS with approaches in feminist geography have emerged to address such critiques and limitations. This work demonstrates how GIS can be used in feminist geographic research to counter traditional aggregate approaches to analysis and direct attention towards individual lived experiences 4. While the literature does not offer a clearly-defined methodology for ‘doing’ feminist GIS, common elements include the integration of qualitative and quantitative data, sensitivity to subjective spatial knowledge, empowerment of research subjects, and iterative and reflexive approaches to analysis.678
Challenges in visualizing the data
There are a number of challenges associated with representing subjective, emotional, spatial data. Firstly, GIS does not have a well-established representational framework for emotional data. The many dimensions and fuzzy spatial boundaries of emotions such as anxiety cannot be simply visualized using points, lines, or polygons.
For conceptual simplicity and ease of visualization, I also chose to disregard the temporal dimension of my data. However, this choice may limit the accuracy of my findings as emotions such as anxiety vary across both space and time. For example, many of the personal comments related to ephemeral entities, such as passing sirens and crowds. While past work has adapted theories from time geography to visualize individual experiences in space and time,9 this approach is limited in its capacity for interactivity and does not allow for the inclusion of point-based qualitative data.
Main findings
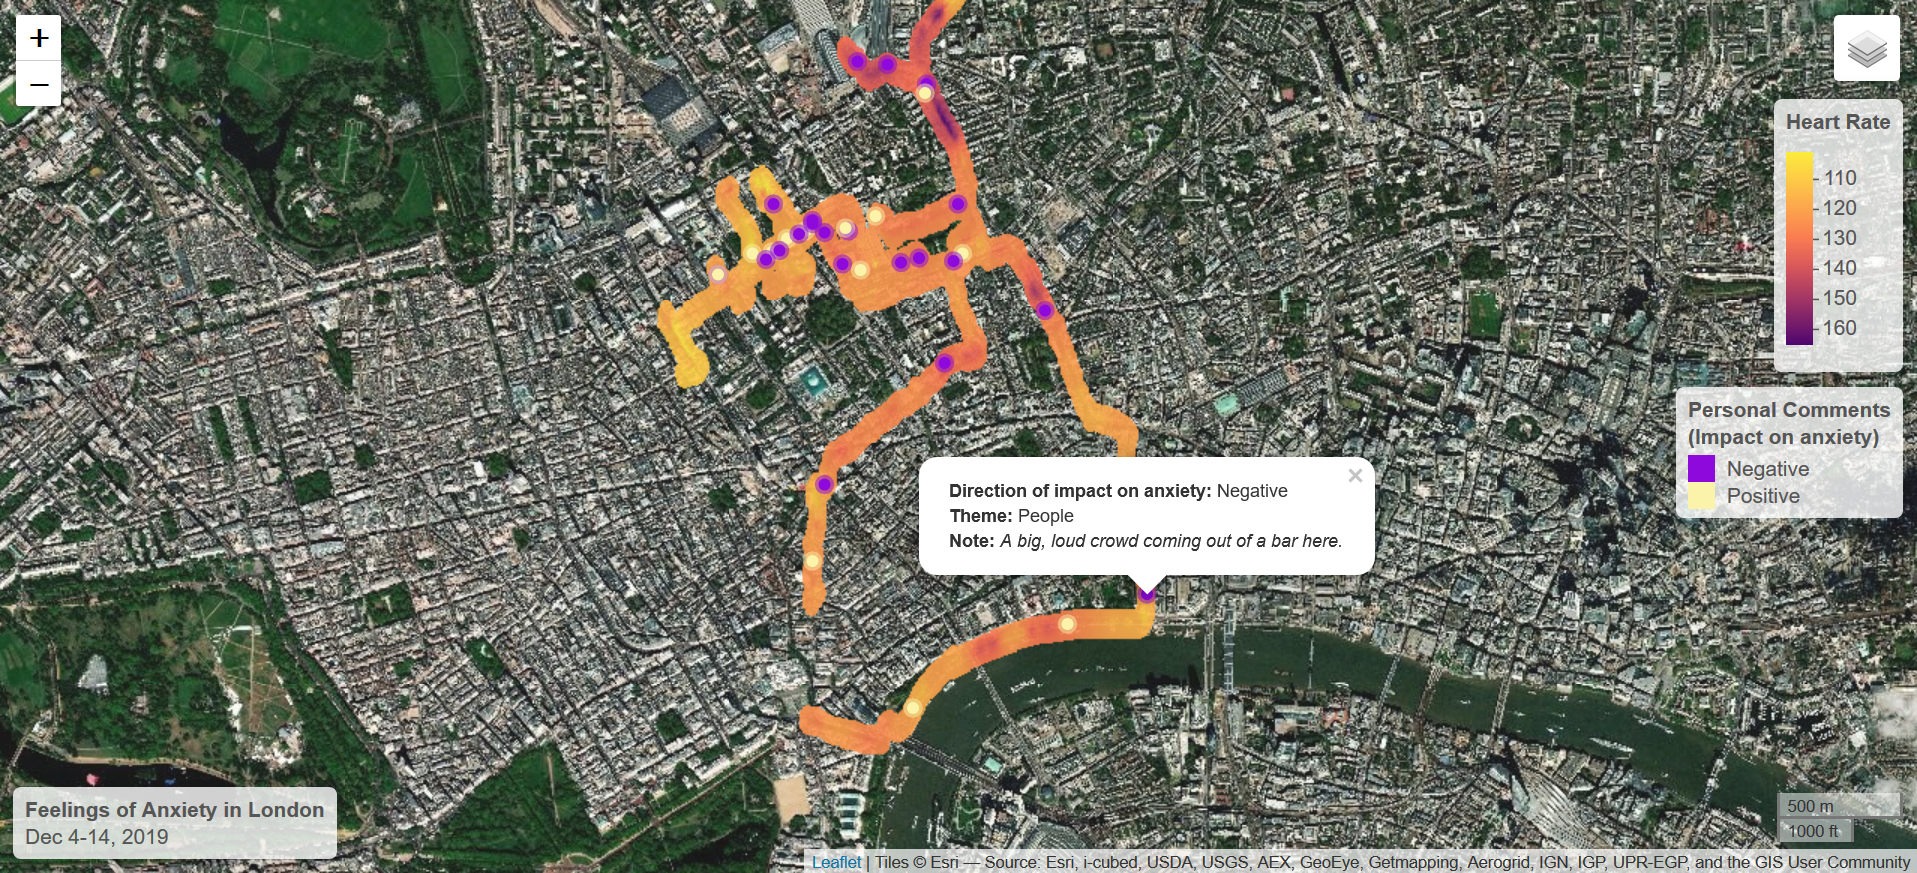
My research findings demonstrate how my levels of anxiety change in complex ways as I move through space in London.
The total study area covered by this map encompasses a region within downtown London that is located primarily within the Camden borough. This map shows that my anxiety levels appear to be relatively stable in the area centered around UCL campus and my residence. This area also has the most complete coverage of the anxiety layer, likely due to more frequent movement in this region. My anxiety levels fluctuate most notably in the northernmost region of the map, near King’s Cross Station and Regent’s Canal.
Overall, it appears as though my levels of anxiety are most stable areas within the city where I have travelled more frequently (indicated by more frequent 10 sampling of heart rate measurements). I experience greater fluctuations in anxiety when I travel to places that I am less familiar with.
See the full interactive version of the map here.
The full methodology from this project is covered here.
- Kwan, M.-P., 2007. Affecting Geospatial Technologies: Toward a Feminist Politics of Emotion. The Professional Geographer 59, 22–34. https://doi.org/10.1111/j.1467-9272.2007.00588.x [return]
- Schuurman, N., 2000. Trouble in the heartland: GIS and its critics in the 1990s. Prog. Hum. Geogr. 24, 569–590. https://doi.org/10.1191/030913200100189111 [return]
- Schuurman, N., Pratt, G., 2002. Care of the Subject: Feminism and Critiques of GIS. Gend. Place Cult. 9, 291–299. https://doi.org/10.1080/0966369022000003905 [return]
- McLafferty, S.L., 2002. Mapping Women’s Worlds: Knowledge, power and the bounds of GIS. Gend. Place Cult. 9, 263–269. https://doi.org/10.1080/0966369022000003879 [return]
- Kwan, M.-P., 2002. Feminist Visualization: Re-envisioning GIS as a Method in Feminist Geographic Research. Ann. Assoc. Am. Geogr. 92, 645–661. https://doi.org/10.1111/1467-8306.00309 [return]
- Gilbert, M.R., Masucci, M., 2006. The Implications of Including Women’s Daily Lives in a Feminist GIScience. Trans. GIS 10, 751–761. https://doi.org/10.1111/j.1467-9671.2006.01026.x [return]
- Knigge, L., Cope, M., 2006. Grounded Visualization: Integrating the Analysis of Qualitative and Quantitative Data through Grounded Theory and Visualization. Environ. Plan. Econ. Space 38, 2021–2037. https://doi.org/10.1068/a37327 [return]
- Pavlovskaya, M., Martin, K.S., 2007. Feminism and Geographic Information Systems: From a Missing Object to a Mapping Subject. Geogr. Compass 1, 583–606. https://doi.org/10.1111/j.1749-8198.2007.00028.x [return]
- Kwan, M.-P., 1999b. Gender, the Home-Work Link, and Space-Time Patterns of Nonemployment Activities. Econ. Geogr. 75, 370–394. https://doi.org/10.1111/j.1944-8287.1999.tb00126.x [return]